
A few weeks ago, Maxwell presented its data-driven financial materiality methodology to an industry workshop of reporters, assurers, investors and data platforms. On the day, the feedback was positive and the consensus was to move from proof-of-concept pilots to real world Beta projects.
As we roll out the Beta projects, we wanted to collect and share honest feedback from users.
This article sets out the feedback from reporters. Other articles focus on the approach and on the investor experience.
We welcome all feedback as we build out the product, please do let us know….. good and bad both welcome!
How are some topics material and some aren’t?
In our approach, a topic isn't material because a workshop or a stakeholder survey said so. It's material because the market behaves as if it is. Our model starts from a full list of candidate sustainability drivers, organised using the SASB topic taxonomy, and asks which of them actually move with the company's share price. It compares weekly returns with external sentiment associated with those topics. That sentiment is deliberately independent of the company: annual and sustainability reports are excluded from the input so the result can serve as an independent comparison with what the company says about itself. Instead, the sources are news and financial media, specialist trade publications, blogs, forums and selected social media.
Before any topic can count as material, the model has to strip out what isn't about the company at all. Much of a share price's weekly movement simply reflects the industry or the wider market. We frame this as materiality's ‘three body problem’: a movement may be specific to the entity, common to its industry, or part of a wider market movement. To separate these, we use the Frisch–Waugh–Lovell theorem, which allows the effect of control variables to be removed from both the dependent and explanatory variables before the regression coefficients are calculated. Only the sentiment signal that still lines up with returns after the sector and index have been accounted for can make a topic material for that specific company.
The cut-off between material and immaterial is where our method is most distinctive. An earlier machine-learning version still depended on arbitrary thresholds for materiality, so we have moved to a convex-optimisation approach. It borrows Sparsemax, a technique from transformer models that projects weights onto a probability simplex and derives a threshold below which all values are set to zero. The data sets the threshold, not an analyst. Topics above the line become ‘active’ drivers with a share of the allocation. Non-active drivers are reduced to zero, so attention can focus on the smaller set that contributes to the model for the period examined. To stop correlated topics from making the results unstable, the Ledoit–Wolf shrinkage method computes an analytically optimal shrinkage intensity without needing cross-validation.
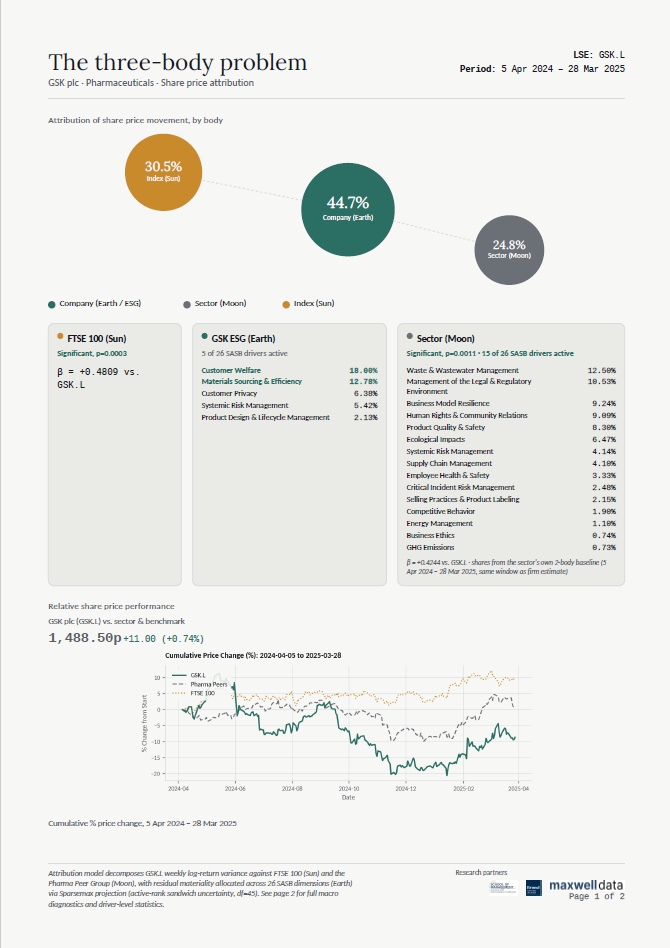
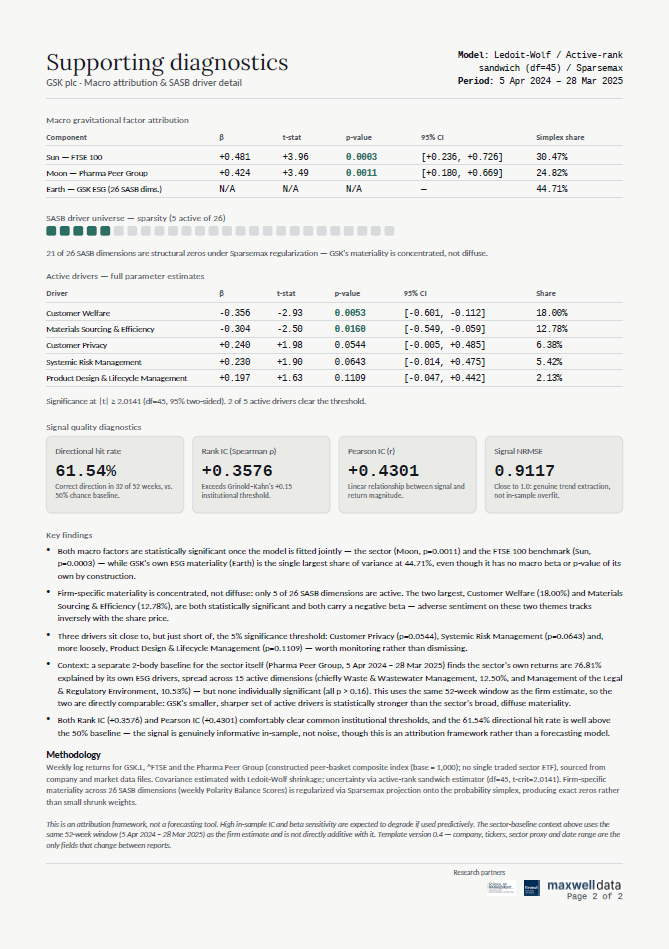
GSK shows how this works in practice. Over a 52-week window to March 2025, the sector accounted for nearly a quarter of GSK's log-returns variance, while the index exerted 30% pull on its weekly price. About 45% of the weekly movement was attributed to sustainability drivers unique to GSK, made up of five drivers: Customer Welfare, Materials Sourcing and Efficiency, Customer Privacy, Systemic Risk Management, Product Design & Lifecycle Management. Every other SASB topic was zeroed out for that period. Materiality can also cut both ways. More positive Customer Privacy sentiment was associated with higher weekly returns, while more negative sentiment on Customer Welfare was associated with lower returns. That sign helps separate a risk from an opportunity.
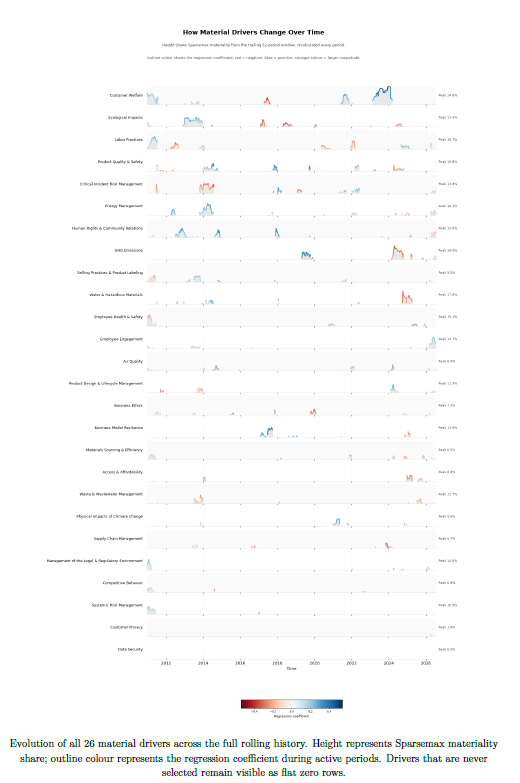
Three body report on BP 2010 - 2026
Materiality in this model is also not fixed, as seen in the above example. When BP had few major company-specific events, as in 2016–2017, the sector and index explained its share price and the model returned fewer unique drivers; during the 2023–2024 energy crisis, it immediately returned a number of active drivers. A topic that is immaterial in a quiet year can become material when events put it in front of investors. For that reason, the analysis could be rerun during or between reporting cycles rather than relying on a static annual assessment.
A few points to be careful about in this analysis:
“Active" doesn't mean "statistically significant." A driver may remain active in the allocation even when its p-value does not pass a conventional threshold, and the two diagnostics answer different questions.
This is association, not causation. The allocations show relative importance within the model and should not be read as a statement that a given percentage of return was caused by one topic. This is the subject of a different analysis that is currently being worked on.
This covers only part of financial materiality. The model analyses a sustainability-related subset of total financial materiality, not as a complete explanation of corporate value.
2. Why do SASB active drivers of Earth (entity) vary from those used for the Moon (industry)?
The main reason is that the two bodies answer different questions. The Earth (the entity) is the listed company whose weekly share-price return is being examined, and the Moon is the peer group, the industry whose movement strongly influences the company. The Moon's drivers describe the sustainability sentiment that moves a whole industry. The Earth's drivers describe only what is left once that shared movement has been accounted for. The model separates these layers using the Frisch–Waugh–Lovell theorem, which removes the effect of control variables from both the dependent and explanatory variables before calculating the coefficients. As a result, a topic the entire sector is talking about tends to be credited to the Moon. Only sentiment that is distinctive to the company can become an Earth driver. The two lists are therefore not supposed to match. They are two different layers of the same share-price movement.
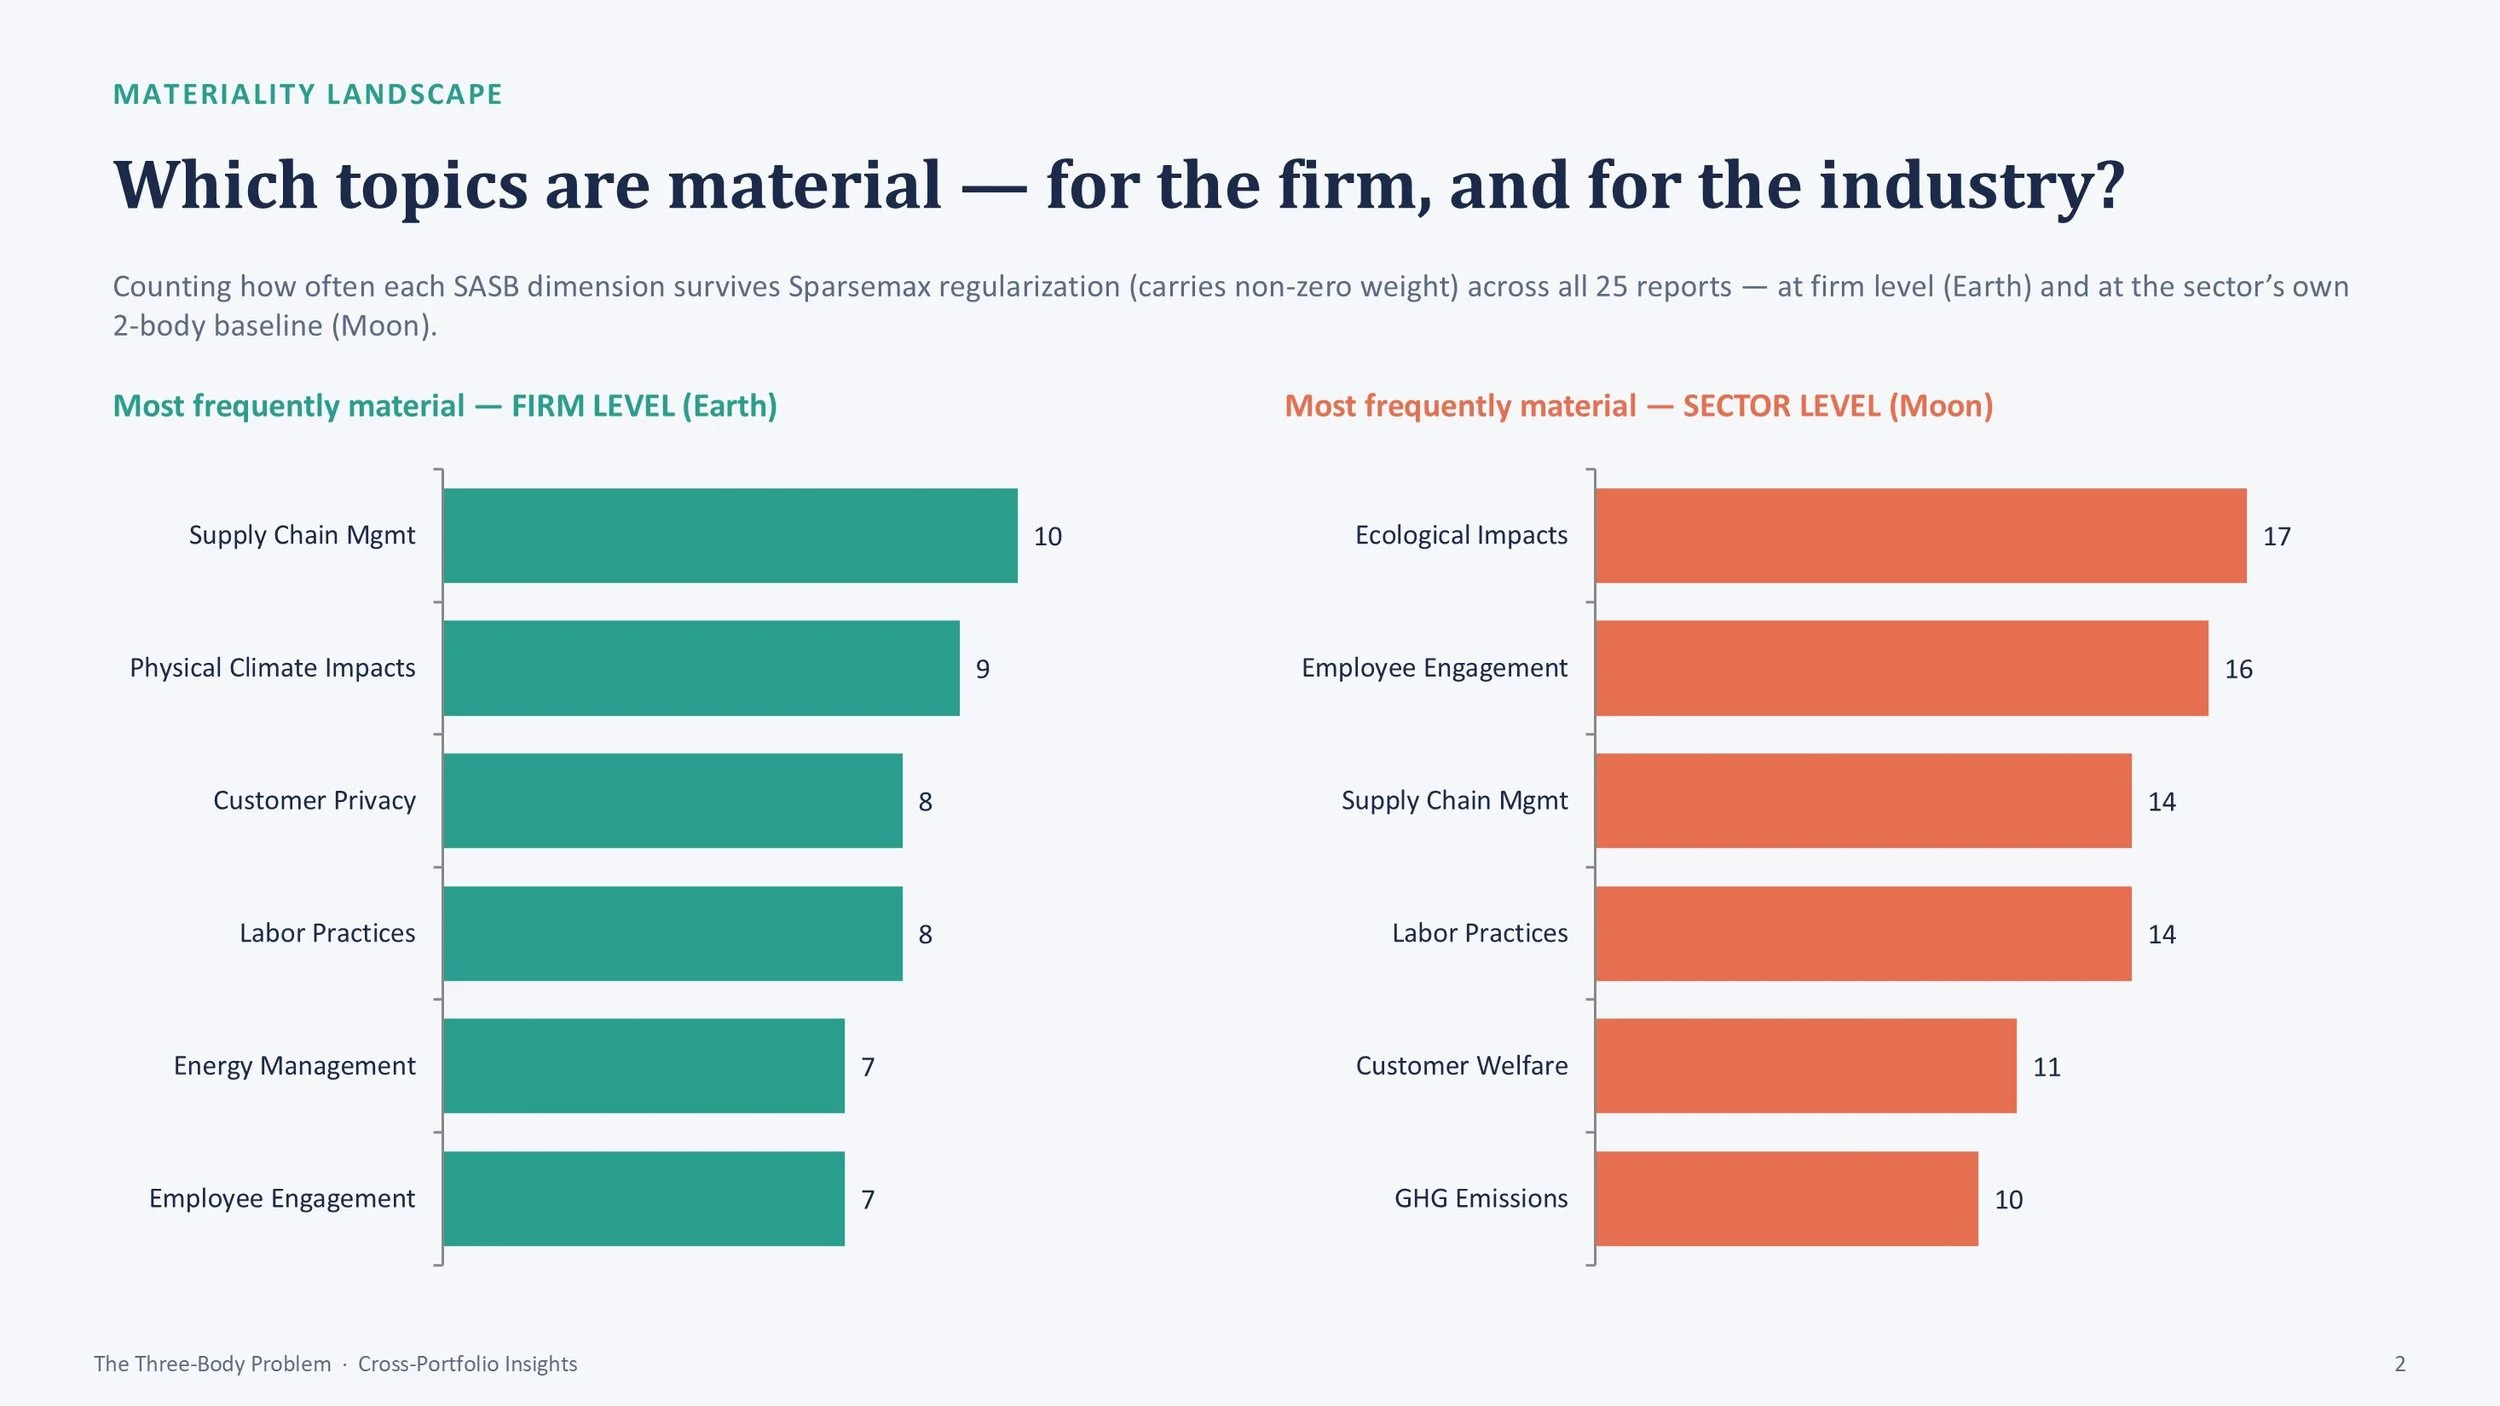
The proof-of-concept results bear this out. Across a portfolio of 25 companies spanning the 11 SASB industries, Supply-chain management, Physical Impacts of Climate Change and Customer Privacy recurred as company-specific drivers. Ecological Impacts, Employee Engagement, Supply-chain management and Labour Practices recurred at industry level. Some topics, such as Supply Chain, appear in both lists. That overlap is consistent with the design: a topic can matter to an industry as a whole and also matter in a different way to one company within it. The gap between the two layers can itself be informative. Negative company-specific sentiment can outweigh a rising industry or market, so a widening difference between a company and its peers may serve as an early warning.
Source: Maxwell Data
3. Why does the number of active drivers change from one report to the next?
There is no fixed quota of material topics. We use Sparsemax to derive a cut-off from the data itself, and all values below it are zeroed out. The number of drivers that survive depends on how much distinctive signal exists in the period examined. The BP example above is a good illustration. In quiet periods with few major company-specific events, such as 2016–2017, the sector and index explained the share price and the model returned fewer unique drivers. During the 2023–2024 energy crisis, it immediately returned a number of active drivers. A report with three drivers and another with seven are not necessarily inconsistent. They may describe a quiet year and an eventful one.
The count is also sensitive to choices made before the model runs. Peer-group construction is one of the most important methodological decisions. Very small, company-chosen groups give unstable or extreme results, while broad ETFs could be too smoothed to show useful industry dynamics. Groups of roughly 10 to 50 companies, centred on about 30, prove more robust. Because the Earth's drivers are what remains after the Moon is removed, a different peer group changes what remains. The input data matters too. Sentiment classification thresholds are set conservatively to reduce false positives, and coverage centres on the UK, Europe and the US, with more limited coverage elsewhere and no complete Mandarin-language dataset. A topic with little external coverage cannot easily become an active driver, however important it is inside the company.
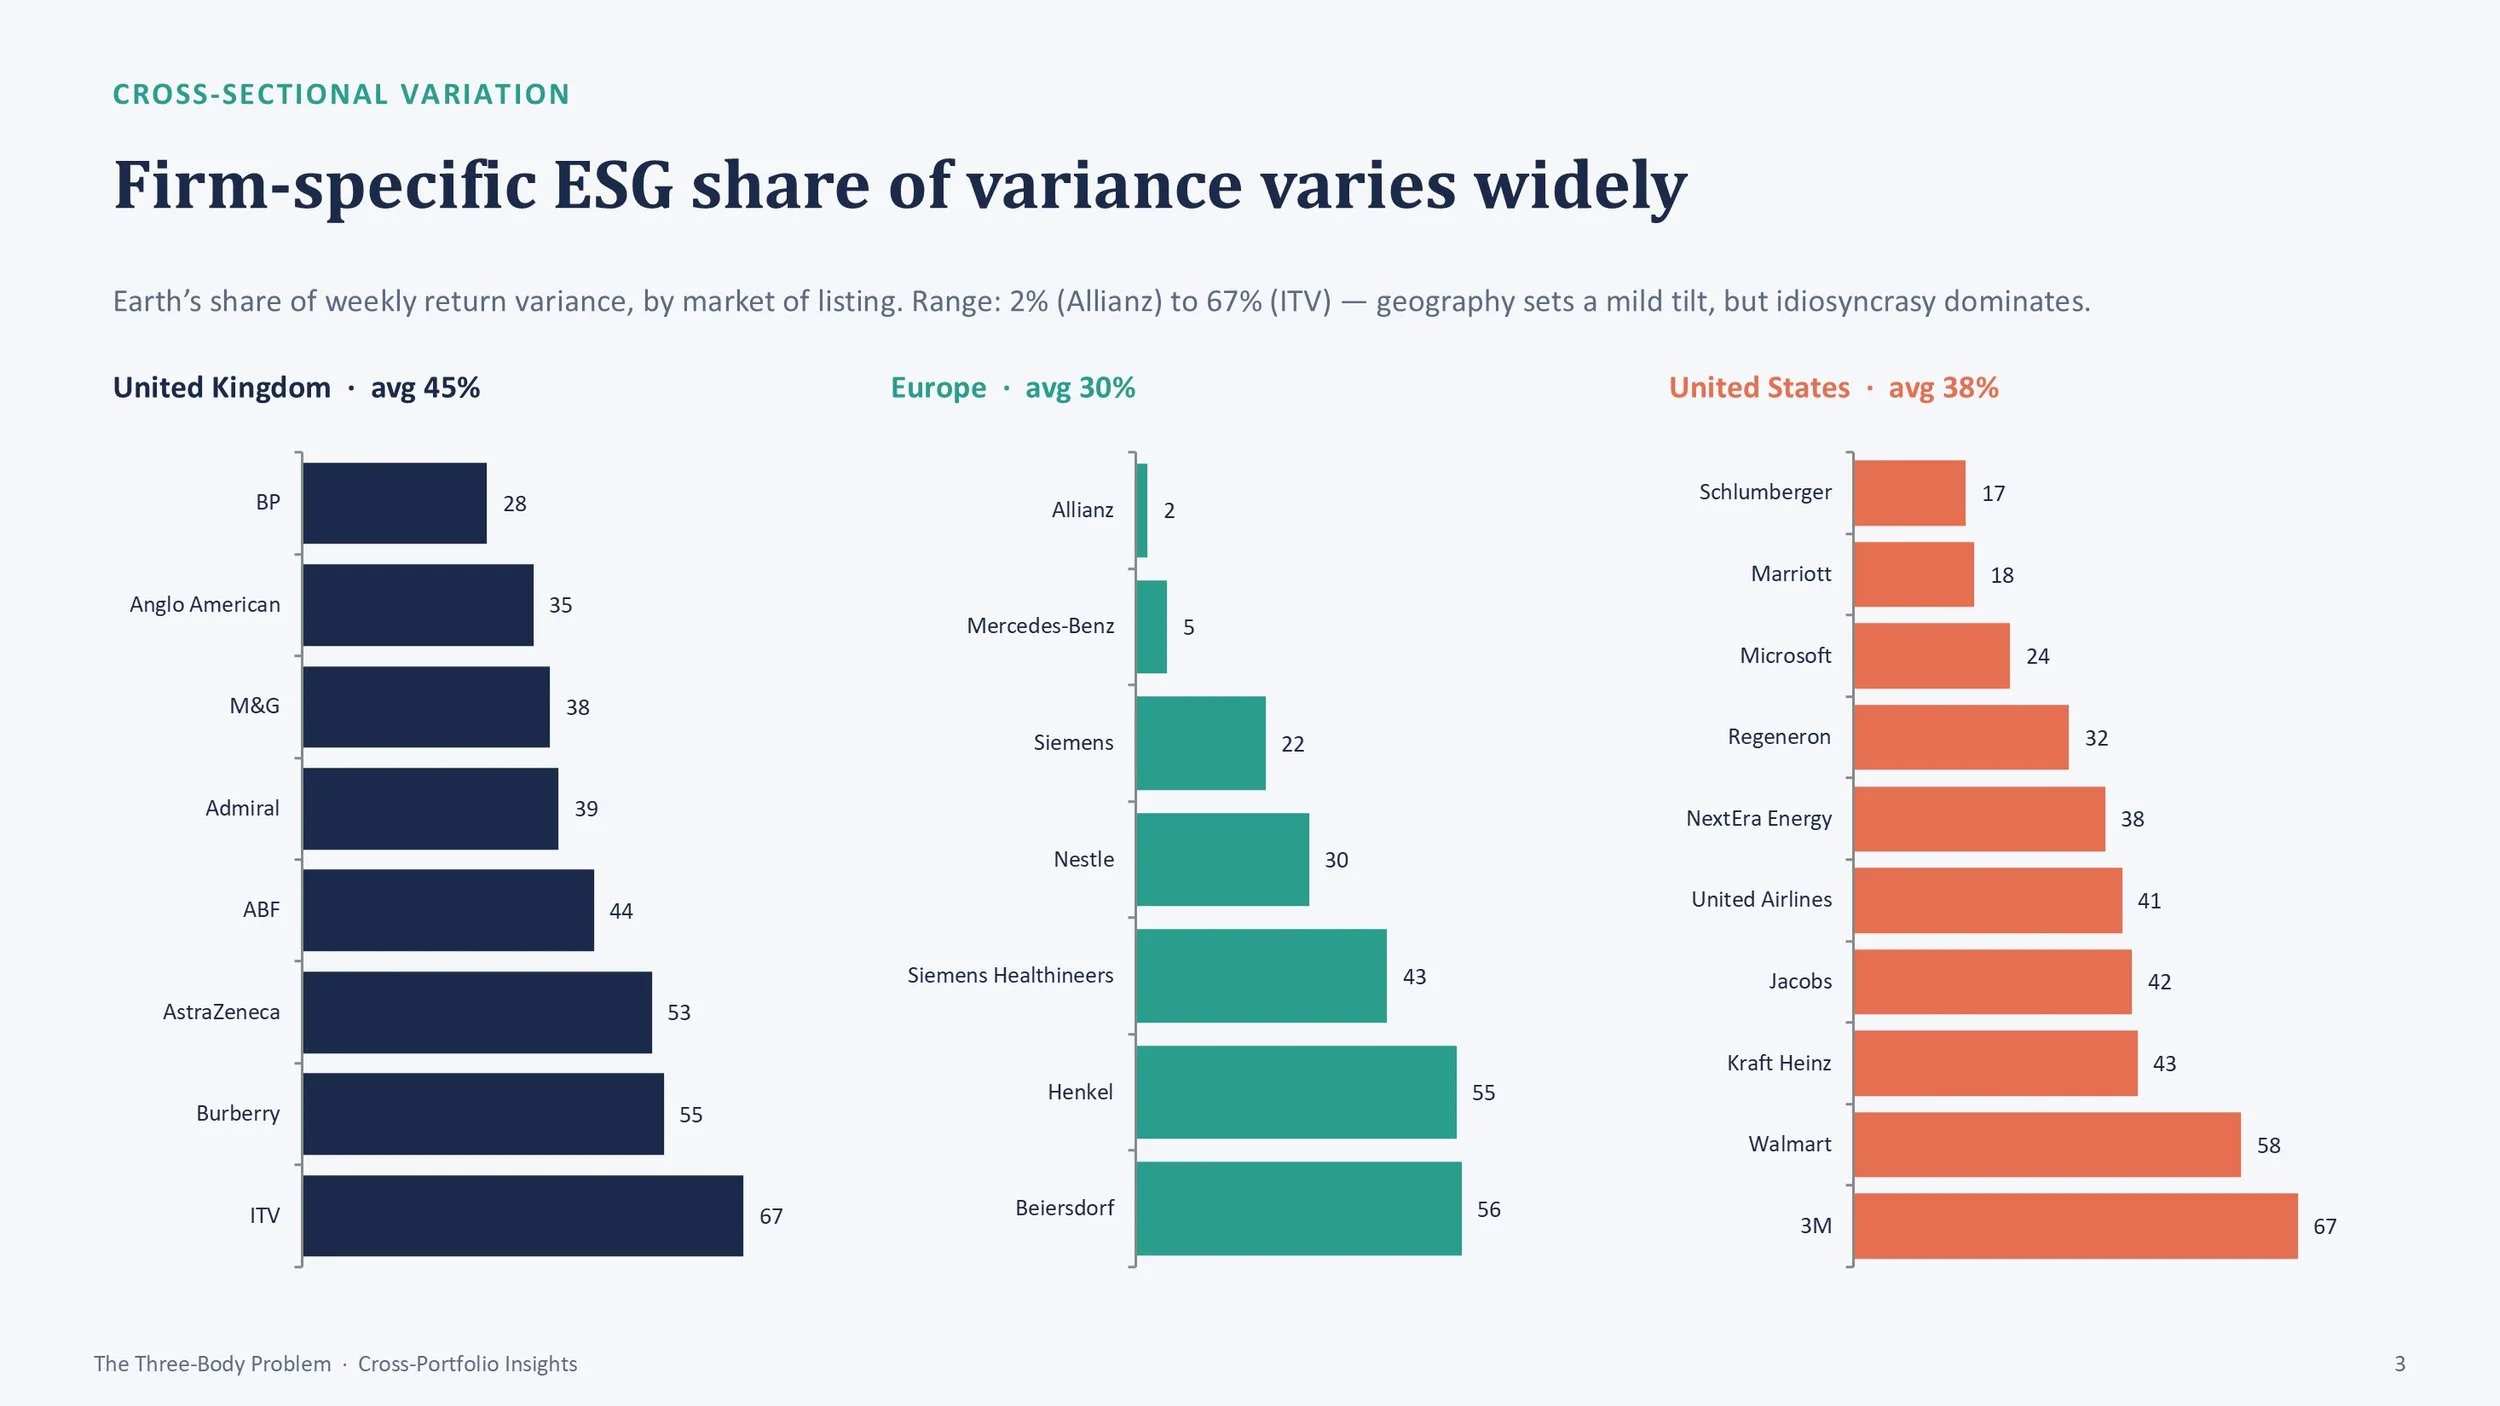
Source: Maxwell Data
4. What does this mean for comparability?
This is an important point for reporters. In order to make the analysis truly comparable, in contrast to the current manual process, several next steps were requested during the workshop. These include clearly distinguishing active drivers, statistical significance, relative allocation and absolute explanatory power, and adding 1-, 3- and 5-year time horizons. They also include transparent rules for peer-group selection, with a minimum viable group size and controls for dominant companies, and letting users inspect the source stories, volume, language and sentiment behind each topic so outputs can be challenged and assured.
In practice, comparability depends less on getting the same number of drivers each time and more on holding the method constant: the same window, the same peer-group rules, the same benchmark. Readers also need to be clear about what a driver count can and cannot tell them. The allocations show relative importance within the model and are not a statement that a fixed percentage of return was caused by one topic. On that reading, a variable count is the cost of a threshold that responds to evidence rather than to a pre-set list.
A separate piece of research is currently underway that addresses this final point. We will update this article with that research shortly.