
Data-driven materiality for Assurance providers
Workshop purpose
We gathered a number of corporate reporters, together with assurance providers, institutional investors and data platforms, at UCL’s Centre for Sustainable Business in September 2026. This was the second industry workshop on a data-driven approach to financial materiality for sustainability matters. It followed an initial workshop in May at Brunel University and a series of proof-of-concepts completed over the summer with reporters, investors, assurers and other stakeholders.
The objective was to test whether the proposed methodology is understandable, robust, and useful across different use cases, and whether it could support a standard way of calculating financial materiality that is explainable, repeatable and objective. The workshop was conducted under Chatham House rules.
Key Insights and Learnings
There are 6 discrete use cases: corporate reporter, SME reporter, assurance provider, institutional investor, financial data provider, strategic advisory
Better explanation of the framework required
Link material topics to reportable IROs
Predictive analysis for investors, but also for reporters
Apply the approach to SMEs and private companies
Structure
This note focuses on the ‘Assurance Provider’ use case and is structured as follows:
The three-body framework
Proof-of-concept insights
Assurer perspective
Workshop outcomes
Next steps
1. The three-body framework
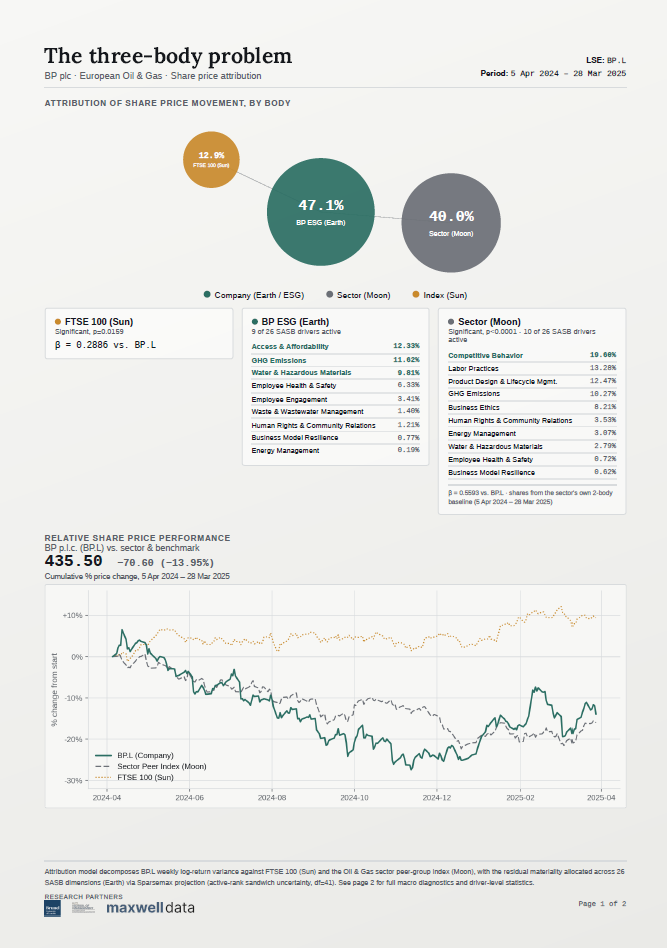
The Earth: the company – the listed entity whose weekly share-price return is being examined.
The Moon: the peer group – the industry whose movement exerts a strong influence on the company.
The Sun: the index – the wider market benchmark against which company and industry effects are placed in context.
The analogy reflects the classical three-body problem. In the financial-materiality model, a company cannot be interpreted in isolation: a movement may be specific to the entity, common to its industry, or part of a wider market movement.
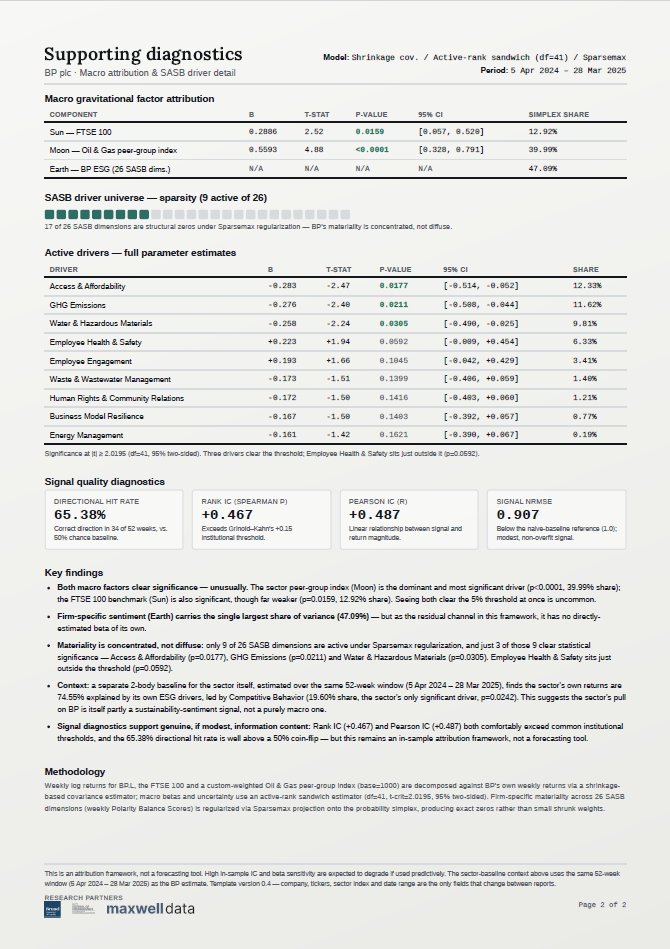
The model uses the SASB topic taxonomy to organize sustainability drivers. It compares weekly returns with external sentiment associated with those topics, then allocates relative importance across the company, peer group, index, and active sustainability drivers. Non-active drivers are reduced to zero, allowing attention to focus on the smaller set that contributes to the model for the period examined.
Source: Maxwell Data
What the model measures, and what it does not
It measures association – the analysis identifies sustainability sentiment that moves with weekly stock returns after industry and index effects have been considered.
It is relative – the allocations show which factors are more important than others within the model. They should not be read as an exact statement that a particular percentage of total return was caused by one topic.
It is retrospective – the proof-of-concepts assess historical alignment. They do not yet predict future returns.
It distinguishes activity from statistical significance – a driver may remain active in the allocation even when its conventional p-value does not pass a particular threshold. The two diagnostics answer different questions and should be displayed separately.
It is not the whole share-price model – earnings, pipeline, operations, capital allocation, innovation, macroeconomics, and many other factors also affect valuation. The current work isolates a sustainability-related component.
Source: Maxwell Data
External sentiment data
The analysis intentionally uses information available in the external market rather than content produced directly by the company. Company annual and sustainability reports are excluded from the sentiment input so that the result can provide an independent comparison with what the company says about itself.
Sources – news and financial media, specialist trade publications, blogs, forums and selected social-media sources. The strongest industry-specific signal was often found in specialist trade publications. Twitter was not used at the time because of data-quality concerns, and broadcast media was not captured directly.
Company material – company-owned webpages and reports are filtered out as inputs, although external discussion prompted by a company announcement is captured.
Authenticity – the team monitors short-lived accounts, bots, duplicated content, public-relations material, and other indications of manufactured conversation. Source selection remains an ongoing control rather than a solved problem.
Language and geography – local-language material is important because English-language discussion of a non-UK company can be global or less representative. At the time of the workshop, coverage centered on the UK, Europe, and the United States, with more limited coverage elsewhere and no complete Mandarin-language dataset.
Classification – machine reading uses a contextual library of approximately 77,000 keywords and phrases to assign relevant items to SASB topics and classify sentiment as positive, neutral, or negative. Thresholds are set conservatively to reduce false positives.
Persistence – sentiment is not treated as disappearing the day after publication. A decay factor recognizes that information can continue to influence market understanding over subsequent weeks.
Participants emphasized that this is sentiment about matters such as greenhouse-gas emissions, not a direct measurement of the emissions themselves. The model assumes that underlying reported facts are broadly accurate and analyses how the wider market responds to, interprets, or questions them.
2.Proof-of-concept portfolio insights
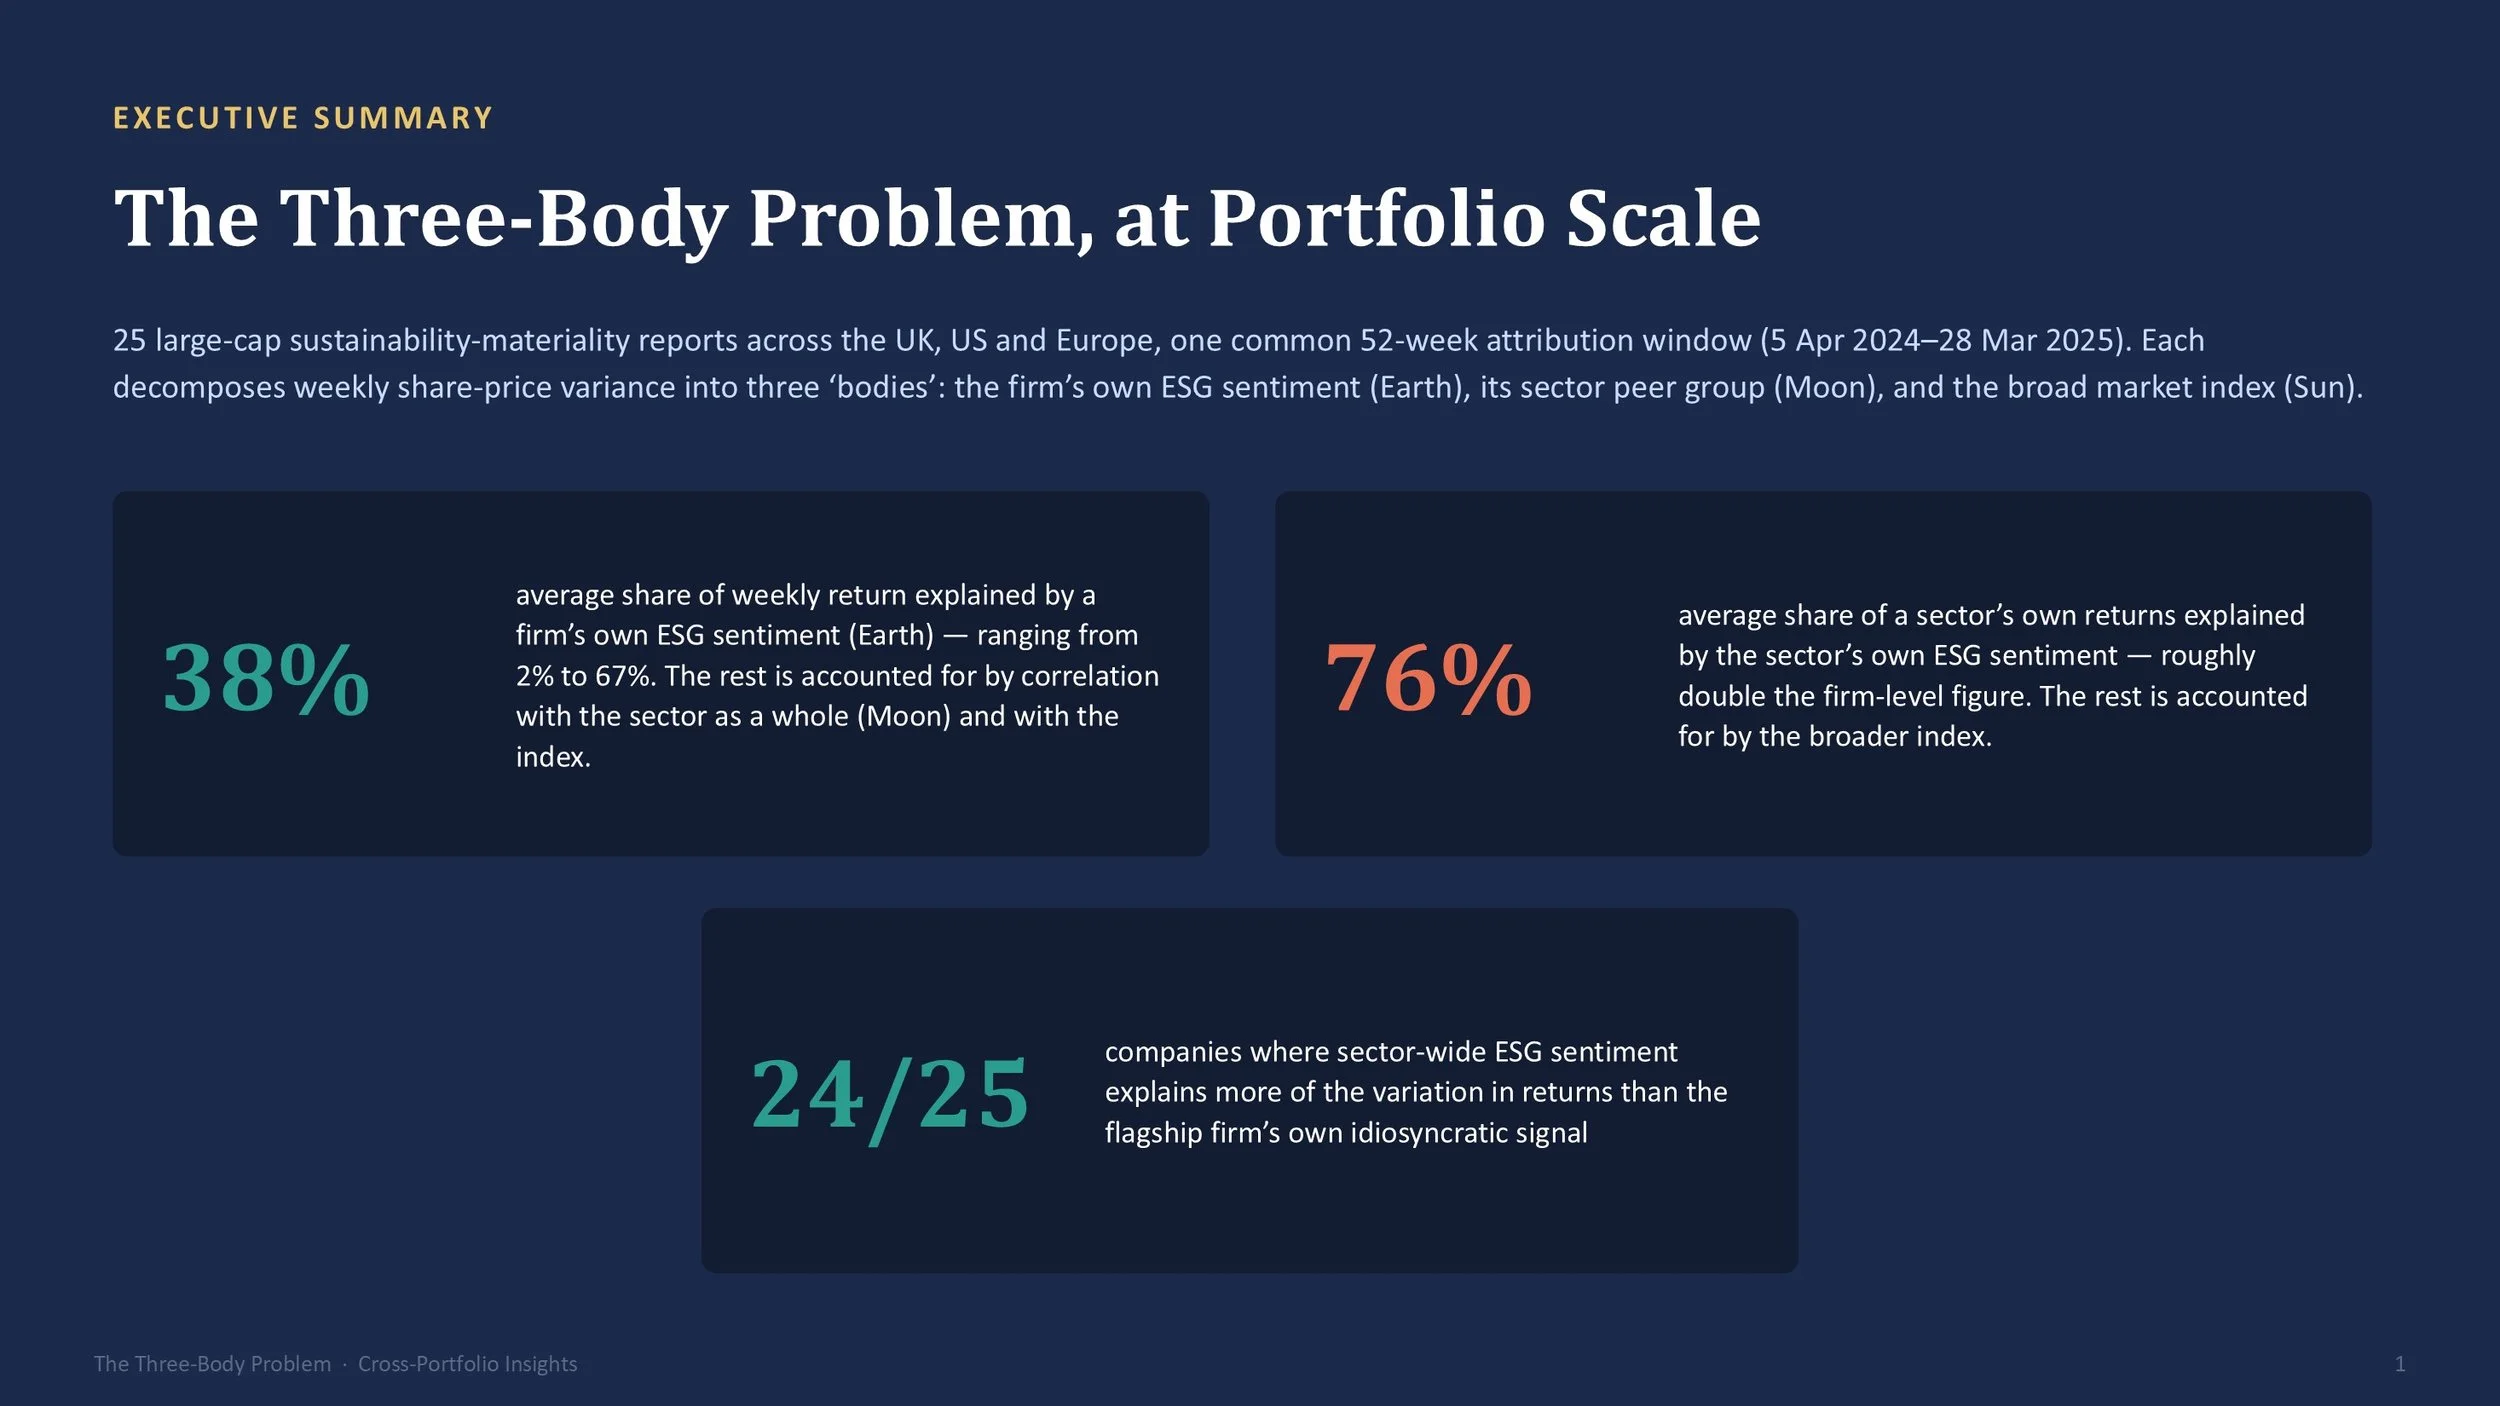
The presentation summarized analysis across a portfolio of 25 listed companies spanning the 11 SASB industries. The broader working database contains around 1,500 companies, principally in the UK, Europe, and the United States. The figures were presented as early evidence from a developing model rather than universal conclusions.
Company-specific movement remains material – on average, approximately 38% of weekly return variation in the initial portfolio was described as unique to the entity, although results varied substantially between companies.
The industry effect was often stronger – for 24 of the 25 companies examined, industry-wide sustainability sentiment explained more variation than the firm's own idiosyncratic sustainability signal.
Recurring firm-level topics – supply-chain management, physical impacts of climate change and customer privacy appeared repeatedly among company-specific drivers.
Recurring industry-level topics – ecological impacts, employee engagement, supply-chain management and labour practices appeared repeatedly at industry level
Divergence can be informative – negative company-specific sentiment can outweigh a rising industry or market. A widening difference between company and peer-group sentiment may therefore provide an early warning for reporters, investors, lenders, or insurers.
Directional hit rate is a diagnostic – the team compared the sign of the sentiment signal with the sign of weekly return. A 50% result would be equivalent to chance in a two-direction test; performance above that level is evidence of alignment, not a forecast.
Source: Maxwell Data
Peer-group construction
The choice of peer group emerged as one of the most important methodological decisions. Very small groups chosen by a company produced unstable or extreme results, while broad exchange-traded funds could be too smoothed to reveal useful industry dynamics. The proof-of-concepts suggested that a group of roughly 10 to 50 companies, with about 30 as a practical center point, created a more robust evidence base.
A further suggestion was to test whether peer groups could be derived from the similarity of active drivers rather than only from a pre-existing industry classification. This could reveal economically relevant relationships that do not map neatly onto conventional industry boundaries.
3. Assurance perspective
Assurance providers explained that their primary task is normally to test the process through which a company reached its materiality conclusions. They do not automatically substitute their own conclusion for managements, but they seek contradictory evidence, examine potential bias and test whether governance and challenge were properly documented.
Independent challenge – compare the company's materiality assessment with external sentiment and ask why an externally prominent topic is absent.
Peer comparison – identify where several close peers treat a topic as material, but the company is an outlier, then require a clear explanation of the difference.
Stakeholder selection – test how investors, employees and other stakeholders were chosen, how many responded and whether the sample introduced systematic bias.
Governance evidence – review how executives and the board challenged the assessment and how the final judgement was recorded.
Professional capability – financial-audit skills alone are not sufficient. Sustainability assurance requires enough subject-matter knowledge to understand emerging risks, impacts and the relationship between impact and financial materiality.
The discussion suggested that the model could strengthen assurance evidence, but only if its source coverage, peer-group rules, classifications, and limitations are transparent enough to be audited. An opaque score would reproduce the very problem the project is intended to solve.
Participants warned against describing correlation as prediction or causation. They also noted that investment and ratings processes increasingly use automated screening. Clear definitions and machine-readable consistency therefore matter, but binary automated outputs can create new errors when company language does not match a model's search logic.
4. Workshop Outcomes
The workshop supported the direction of a data-driven approach to financial materiality, provided it remains transparent about what it measures and what it leaves out. The three-body framework offers a useful way to distinguish the company from its industry and the wider market, while external sentiment supplies an independent perspective on which sustainability matters are being reflected in market behaviour.
The strongest future proposition is not a single ESG score. It is an explainable, repeatable baseline that shows where company-specific and industry-wide signals differ, connects those signals to specific reporting and investment questions, and sits inside a broader understanding of enterprise value.
5. Next Steps
1. Simplify the presentation and distinguish clearly between active drivers, statistical significance, relative allocation, and absolute explanatory power.
2. Include 1, 3 and 5-year time horizons to speak to short-, medium- and long-term time horizons.
3. Develop transparent rules for peer-group selection, including minimum viable group size and controls for dominant companies.
4. Allow users to inspect the source stories, volume, language, and sentiment underlying each topic so that outputs can be challenged and assured.
5. Validate the signal against analyst research, market-data platforms, ratings, and subsequent performance to test whether it is leading, coincident or lagging.
6. Design practical workflows for assurers, including topic-to-IRO mapping and peer challenge.
7. Test proportionate approaches for small-cap and unlisted companies, including sector proxies or a two-body model where direct market data is insufficient.
8. Show the sustainability-related component within a wider account of financial materiality, including residual and conventional business drivers.