
Data-driven financial materiality for sustainability topics
Or 'Solving materiality's Three Body Problem'
Materiality assessments - both single and double, ISSB and ESRS - have a 3 body problem. When preparing an assessment, the guidance is clear: compare the entity in question to a peer group and an index to give context. This is correct and sensible. But it's remarkably hard to do objectively, in a data-driven methodology, with an auditable process.
Bringing order to chaos
The reason is well-known in classical mechanics or astrophysics. It is called "The three body problem". It is the mathematical study of how three celestial objects (like stars or planets) interact purely through their gravitational pull. While a "two body" system (like the Earth and Sun) has predictable orbits, adding a third body (like Earth's moon) creates a chaotic, unpredictable system with no general mathematical formula to solve it.
In our terms, the reporting company is the Earth, the peer group is Moon and the index is the Sun. We have already determined that we can take closing day share price as a reasonable dependent variable to help us isolate which sustainability drivers are having a real world impact on investors' capital allocation decisions. And we have already solved the one-body problem with standard machine learning processes. So the final step is to scale up the dataset, run the algorithm across multiple entities, and we should have an answer...
The problem with Machine Learning
When we tested the ML solution at scale with real data, we found several fatal problems:
we couldn't remove the sector and index impacts to isolate only the entity's ESG drivers
the high multicollinearity between ESG drivers made the system unstable and rankings volatile
we still had arbitrary thresholds for materiality
as materiality is dynamic, we would need to constantly cross-validate and adjust the hyperparameters
machine learning is black-box by its nature so struggles at audit time.
Time for a Rethink
So we needed a different approach. The one we settled on involves convex optimization and linear algebra instead. Without wanting to pre-empt the academic research paper we are now preparing, there are three key problems which this approach effectively overcomes:
Multicollinearity. The Ledoit–Wolf solution is an elegant way to deal with the overfitting that comes when combining large numbers of sustainability driver data points with limited historical time periods. This solution computes an analytically optimal shrinkage intensity automatically without needing cross-validation, so preventing portfolio optimization algorithms from blowing up on extreme error.
Arbitrary Thresholds. We need to zero out non-material drivers without assuming any arbitrary threshold. There is a concept in transformers (LLMs) called Sparsemax which projects the weight into a probability simplex and gets a threshold, below which all values will be zeroed out.
Removing sector and index effects. Here we use the Frisch–Waugh–Lovell (FWL) theorem which states that multiple regression coefficients can be calculated by first removing ("partialling out") the effect of control variables from both the dependent and explanatory variables. This gives us the correlation coefficients for each of the three bodies.
BP plc example
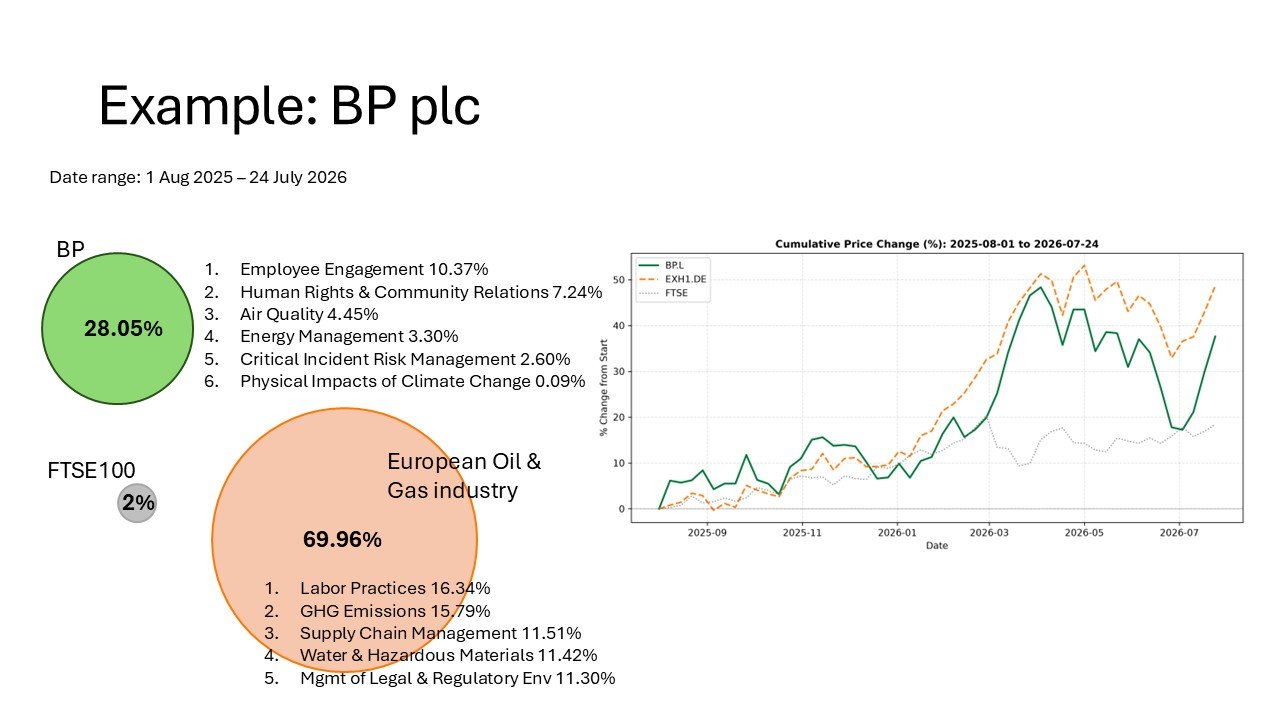
Using our revised approach, we ran a 52-week window to 24 July 2026 using the STOXX European 600 Oil & Gas UCITS ETF as the peer group and the FTSE 100 index as the benchmark. We found:
The sector dominates nearly 70% of BP's log-returns variance. This result was significant with p-value < 0.05.
However, the index exerts no significant pull on BP's weekly stock price.
Only around 30% of BP's weekly stock price movement is attributed to sustainability drivers unique to BP.
That allocation comprises 6 drivers: Employee Engagement, Human Rights & Community Relations, Air Quality, Energy Management, Critical Incident Risk Management, and Physical Impacts of Climate Change.
When there are no major company-specific events, for example between 2016 and 2017, movement in BP's share price is explained by the sector and index and the model returns fewer unique ESG drivers. But when there are frequent major company-specific events, for example during the energy crisis in 2023 and 2024, the model immediately returns a number of specific active drivers.
Source: Maxwell Data
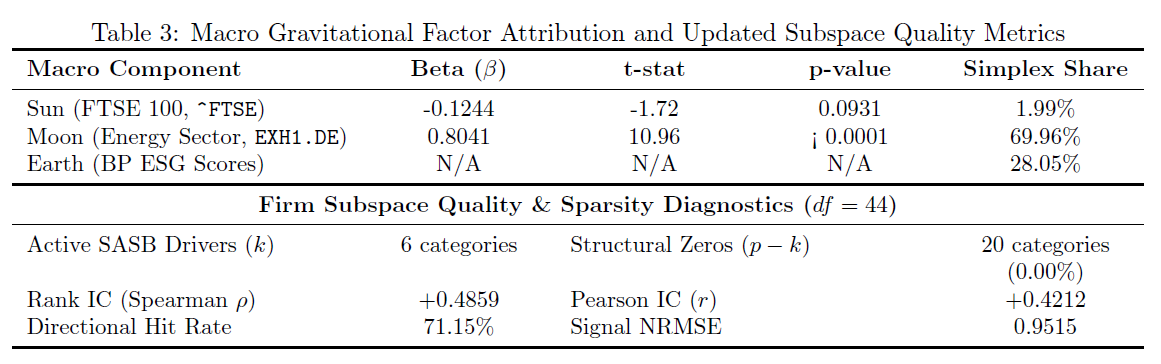
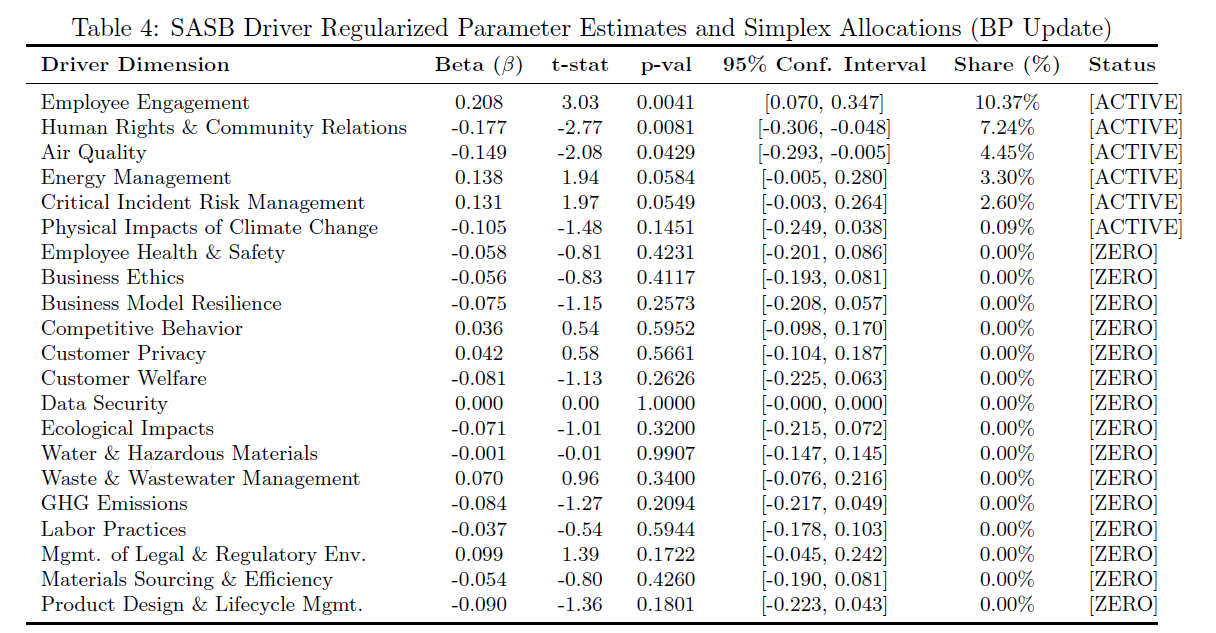
To give more context to the summary slide above, we also include the Macro-level diagnostic (Table 3) and the Firm-specific driver allocations (Table 4), together with a short explanation of each.
Source: Maxwell Data
Directional Hit Rate (71.15%) shows that the combined ESG score and the stock return moved in the same direction.
Rank IC (Spearman p = +0.4859) confirms that top ESG news weeks consistently mapped to top stock performance weeks.
Pearson IC (r = +0.4212) confirms a solid linear relationship between sentiment magnitude and return magnitude.
Signal NRMSE (0.9515) confirms the model extracts genuine directional trends without artificially overfitting in-sample noise.
Source: Maxwell Data
The most material driver is Employee Engagement (β = 0.208, t = 3.03, p = 0.0041) holding the largest firm-specific share at 10.37%.
Second most material driver is Human Rights & Community Relations (β = -0.177, t = -2.77, p = 0.0081) with a firm-specific share at 7.24%.
Third most material driver is Air Quality (β = -0.149, t = -2.08, p = 0.0429) with a firm-specific share at 4.45%.
All three clear the 95% confidence threshold (|t| > 2.0154). Energy Management (3.30% share) and Critical Incidence Risk Management (2.60% share) remain active just below the 5% alpha cutoff.
Source: Maxwell Data
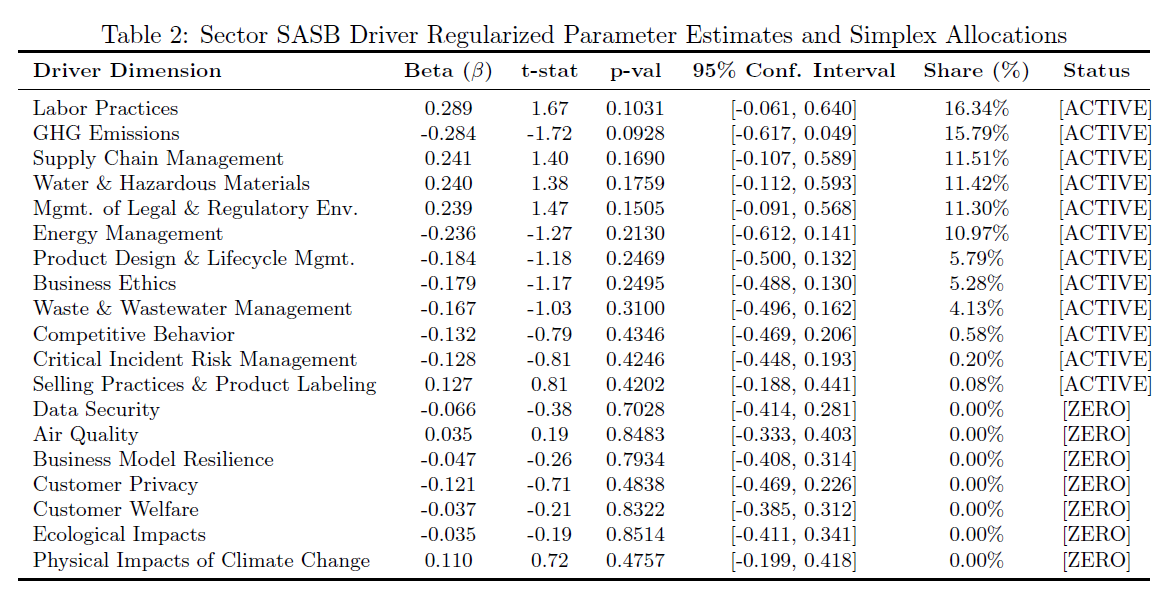
Finally, Table 2 produces the results of the allocation for the European Oil & Gas industry. These are the ESG drivers that are generic across the industry, as opposed to the drivers that are unique to BP. In terms of reporting, these drivers are also material but need to be separated from the drivers unique to the entity so that investors and creditors understand which risks are unique to the entity and which are generic to the industry.
An Industry Standard?
Maxwell Data and the Department of Mathematics at Brunel University of London will present these findings and those from a number of proof-of-concepts at an industry workshop at UCL Centre for Sustainable Business on 18th September. If there is consensus, we will work with stakeholders to roll out a data-driven approach to financial materiality for sustainability matters as an industry standard ahead of reporting season in Q1 2027.